> ## Documentation Index
> Fetch the complete documentation index at: https://docs.gomaestro.org/llms.txt
> Use this file to discover all available pages before exploring further.
# Maestro Market Price API & TradingView Lightweight-Charts Tutorial
> Step-by-step tutorial to build a TypeScript web app using Maestro's Market Price API with TradingView Lightweight Charts for Bitcoin data visualization.
 This tutorial walks you through building a small web app in TypeScript that will:
1. Fetch DOGGOTOTHEMOON ("BTC-840000:3") candlestick data from Maestro’s [Market Price API](https://docs.gomaestro.org/market-price-feeds).
2. Render it as an interactive candlestick chart using the [TradingView](https://www.tradingview.com/) [lightweight-charts](https://github.com/tradingview/lightweight-charts) library.
## Overview
### TradingView - Lightweight Charts™
[TradingView](https://www.tradingview.com/) is a popular web-based platform renowned for its comprehensive and user-friendly charting tools. Users can access a variety of charts for different financial instruments, like stocks, cryptocurrencies, forex, and futures. These charts can be customized with numerous technical indicators and drawing tools to analyze market trends and patterns.
TradingView's [Lightweight Charts](https://tradingview.github.io/lightweight-charts/) is a compact, interactive library designed to create financial charts that are both fast and easy to integrate. Here's a basic guide on how to use it with the Maestro [Market Price API](https://docs.gomaestro.org/market-price-feeds).
***
## Prerequisites
* **Node.js** ≥14 and **npm** (or Yarn) installed
* A Maestro [API key](https://dashboard.gomaestro.org/login)
* Basic familiarity with TypeScript, `fetch`, and bundling (e.g. with esbuild, webpack, or Vite)
***
## Step-by-Step Instructions
### 1. Bootstrap a New Project
```sh Bash theme={null}
# create & enter project folder
mkdir maestro-chart-tutorial && cd maestro-chart-tutorial
# initialize npm
npm init -y
# install runtime and dev dependencies
npm install --save lightweight-charts
npm install --save-dev typescript esbuild live-server
```
Here's what your initial `package.json` should look like:
```json JSON theme={null}
{
"dependencies": {
"lightweight-charts": "^5.0.6"
},
"name": "maestro-chart-tutorial",
"version": "1.0.0",
"description": "",
"main": "index.js",
"scripts": {
"test": "echo \"Error: no test specified\" && exit 1",
},
"keywords": [],
"author": "",
"license": "ISC",
"type": "commonjs",
"devDependencies": {
"esbuild": "^0.25.3",
"live-server": "^1.2.2",
"typescript": "^5.8.3",
}
}
```
Next, create a minimal `tsconfig.json`:
```json JSON theme={null}
{
"compilerOptions": {
"target": "es2017",
"module": "esnext",
"moduleResolution": "node",
"strict": true,
"outDir": "dist"
},
"include": ["src/**/*"]
}
```
***
### 2. Project Structure
```text Text theme={null}
maestro-chart-tutorial/
├── package.json
├── src/
│ ├── main.ts ← chart logic
│ └── index.html ← HTML container for the chart
└── tsconfig.json
```
***
### 3. Write the HTML Shell
Create `src/index.html`:
```html HTML theme={null}
DOGGOTOTHEMOON Candlestick Chart
```
***
### 4. Fetch & Transform Candle Data
Create `src/main.ts`:
```ts Text theme={null}
import {
createChart,
CandlestickSeries,
} from 'lightweight-charts';
// ─── Configuration ─────────────────────────────────────────────────────────────
const API_BASE = 'https://xbt-mainnet.gomaestro-api.org/v0/markets';
const DEX = 'magiceden';
const SYMBOL = 'BTC-840000:3'; // DOGGOTOTHEMOON
const RESOLUTION = '1d'; // 1‑day candles
const API_KEY = 'YOUR_API_KEY_HERE'; // ← Replace with your API key
interface Candle {
bucket: string;
open: number;
high: number;
low: number;
close: number;
volume: number;
symbol: string;
}
async function fetchCandles(mempool?: boolean) {
const url = new URL(`${API_BASE}/dexs/ohlc/${DEX}/${SYMBOL}`);
url.searchParams.set('resolution', RESOLUTION);
// for Mempool Market Price data
if (mempool) {
url.searchParams.set('mempool', 'included');
}
const resp = await fetch(url.toString(), {
headers: {
'api-key': API_KEY,
},
});
if (!resp.ok) {
throw new Error(`API error: ${resp.status} ${resp.statusText}`);
}
const json = await resp.json();
const candles = json.data as Candle[];
return candles.map(c => ({
time: Math.floor(new Date(c.bucket).getTime() / 1000) as UTCTimestamp,
open: c.open,
high: c.high,
low: c.low,
close: c.close,
}));
}
```
***
### 5. Initialize & Draw the Chart
Append to `src/main.ts`:
```ts Text theme={null}
async function drawChart() {
// Create chart
const chartOptions = {
layout: {
textColor: 'black',
background: { type: 'solid', color: '#ffffff' },
},
grid: {
vertLines: { color: '#eee' },
horzLines: { color: '#eee' },
},
rightPriceScale: { borderVisible: false },
timeScale: { borderVisible: false, timeVisible: true },
}
const chart = createChart(document.getElementById('chart'), chartOptions);
const series = chart.addSeries(CandlestickSeries, {
upColor: '#26a69a',
downColor: '#ef5350',
borderVisible: false,
wickUpColor: '#26a69a',
wickDownColor: '#ef5350',
});
// Load data & render
try {
// Fetch candlestick data
const candles = await fetchCandles();
// Set candlestick data
series.setData(candles);
// Format for better readability
chart.timeScale().fitContent();
} catch (err) {
console.error(err);
alert('Failed to load candle data; see console.');
}
}
// Run
drawChart();
```
***
### 6. Bundle & Serve
Add these scripts to `package.json`:
```json JSON theme={null}
{
"scripts": {
"build": "esbuild src/main.ts --bundle --outfile=src/main.js --platform=browser",
"start": "npm run build && live-server src"
}
}
```
Then:
```sh Bash theme={null}
npm run start
```
* **esbuild** bundles your code into `main.js`.
* **live-server** serves `src/index.html` at [http://127.0.0.1:8080](http://127.0.0.1:8080).
***
### Interactive TradingView Chart
If you're able to see a chart like this displayed in your browser, then you have successfully fetched data through the API and rendered the chart.
This tutorial walks you through building a small web app in TypeScript that will:
1. Fetch DOGGOTOTHEMOON ("BTC-840000:3") candlestick data from Maestro’s [Market Price API](https://docs.gomaestro.org/market-price-feeds).
2. Render it as an interactive candlestick chart using the [TradingView](https://www.tradingview.com/) [lightweight-charts](https://github.com/tradingview/lightweight-charts) library.
## Overview
### TradingView - Lightweight Charts™
[TradingView](https://www.tradingview.com/) is a popular web-based platform renowned for its comprehensive and user-friendly charting tools. Users can access a variety of charts for different financial instruments, like stocks, cryptocurrencies, forex, and futures. These charts can be customized with numerous technical indicators and drawing tools to analyze market trends and patterns.
TradingView's [Lightweight Charts](https://tradingview.github.io/lightweight-charts/) is a compact, interactive library designed to create financial charts that are both fast and easy to integrate. Here's a basic guide on how to use it with the Maestro [Market Price API](https://docs.gomaestro.org/market-price-feeds).
***
## Prerequisites
* **Node.js** ≥14 and **npm** (or Yarn) installed
* A Maestro [API key](https://dashboard.gomaestro.org/login)
* Basic familiarity with TypeScript, `fetch`, and bundling (e.g. with esbuild, webpack, or Vite)
***
## Step-by-Step Instructions
### 1. Bootstrap a New Project
```sh Bash theme={null}
# create & enter project folder
mkdir maestro-chart-tutorial && cd maestro-chart-tutorial
# initialize npm
npm init -y
# install runtime and dev dependencies
npm install --save lightweight-charts
npm install --save-dev typescript esbuild live-server
```
Here's what your initial `package.json` should look like:
```json JSON theme={null}
{
"dependencies": {
"lightweight-charts": "^5.0.6"
},
"name": "maestro-chart-tutorial",
"version": "1.0.0",
"description": "",
"main": "index.js",
"scripts": {
"test": "echo \"Error: no test specified\" && exit 1",
},
"keywords": [],
"author": "",
"license": "ISC",
"type": "commonjs",
"devDependencies": {
"esbuild": "^0.25.3",
"live-server": "^1.2.2",
"typescript": "^5.8.3",
}
}
```
Next, create a minimal `tsconfig.json`:
```json JSON theme={null}
{
"compilerOptions": {
"target": "es2017",
"module": "esnext",
"moduleResolution": "node",
"strict": true,
"outDir": "dist"
},
"include": ["src/**/*"]
}
```
***
### 2. Project Structure
```text Text theme={null}
maestro-chart-tutorial/
├── package.json
├── src/
│ ├── main.ts ← chart logic
│ └── index.html ← HTML container for the chart
└── tsconfig.json
```
***
### 3. Write the HTML Shell
Create `src/index.html`:
```html HTML theme={null}
DOGGOTOTHEMOON Candlestick Chart
```
***
### 4. Fetch & Transform Candle Data
Create `src/main.ts`:
```ts Text theme={null}
import {
createChart,
CandlestickSeries,
} from 'lightweight-charts';
// ─── Configuration ─────────────────────────────────────────────────────────────
const API_BASE = 'https://xbt-mainnet.gomaestro-api.org/v0/markets';
const DEX = 'magiceden';
const SYMBOL = 'BTC-840000:3'; // DOGGOTOTHEMOON
const RESOLUTION = '1d'; // 1‑day candles
const API_KEY = 'YOUR_API_KEY_HERE'; // ← Replace with your API key
interface Candle {
bucket: string;
open: number;
high: number;
low: number;
close: number;
volume: number;
symbol: string;
}
async function fetchCandles(mempool?: boolean) {
const url = new URL(`${API_BASE}/dexs/ohlc/${DEX}/${SYMBOL}`);
url.searchParams.set('resolution', RESOLUTION);
// for Mempool Market Price data
if (mempool) {
url.searchParams.set('mempool', 'included');
}
const resp = await fetch(url.toString(), {
headers: {
'api-key': API_KEY,
},
});
if (!resp.ok) {
throw new Error(`API error: ${resp.status} ${resp.statusText}`);
}
const json = await resp.json();
const candles = json.data as Candle[];
return candles.map(c => ({
time: Math.floor(new Date(c.bucket).getTime() / 1000) as UTCTimestamp,
open: c.open,
high: c.high,
low: c.low,
close: c.close,
}));
}
```
***
### 5. Initialize & Draw the Chart
Append to `src/main.ts`:
```ts Text theme={null}
async function drawChart() {
// Create chart
const chartOptions = {
layout: {
textColor: 'black',
background: { type: 'solid', color: '#ffffff' },
},
grid: {
vertLines: { color: '#eee' },
horzLines: { color: '#eee' },
},
rightPriceScale: { borderVisible: false },
timeScale: { borderVisible: false, timeVisible: true },
}
const chart = createChart(document.getElementById('chart'), chartOptions);
const series = chart.addSeries(CandlestickSeries, {
upColor: '#26a69a',
downColor: '#ef5350',
borderVisible: false,
wickUpColor: '#26a69a',
wickDownColor: '#ef5350',
});
// Load data & render
try {
// Fetch candlestick data
const candles = await fetchCandles();
// Set candlestick data
series.setData(candles);
// Format for better readability
chart.timeScale().fitContent();
} catch (err) {
console.error(err);
alert('Failed to load candle data; see console.');
}
}
// Run
drawChart();
```
***
### 6. Bundle & Serve
Add these scripts to `package.json`:
```json JSON theme={null}
{
"scripts": {
"build": "esbuild src/main.ts --bundle --outfile=src/main.js --platform=browser",
"start": "npm run build && live-server src"
}
}
```
Then:
```sh Bash theme={null}
npm run start
```
* **esbuild** bundles your code into `main.js`.
* **live-server** serves `src/index.html` at [http://127.0.0.1:8080](http://127.0.0.1:8080).
***
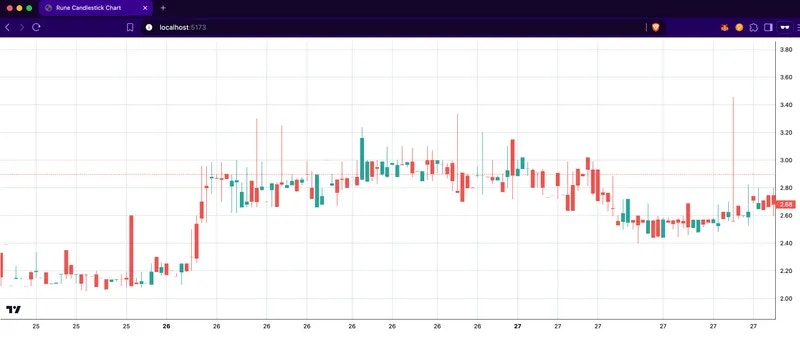
### Interactive TradingView Chart
If you're able to see a chart like this displayed in your browser, then you have successfully fetched data through the API and rendered the chart.
 ***
### 7. Next Steps & Customization
The following considerations can help you to extend this tutorial to fit more of your application's needs.
* You can make the chart data **mempool-aware**- meaning it returns data about trades that have *not yet been confirmed*- by passing in an optional `boolean` value to `fetchCandles()`, such as `const candles = await fetchCandles(true);`
* **Time Range**: add `from`/`to` (Unix seconds) to `fetchCandles()`
* **Carry**: `url.searchParams.set('carry','true')` fills gaps with synthetic candles
* **Styling**: tweak [`createChart` options](https://github.com/tradingview/lightweight-charts#configuration)
* **Interactivity**: add crosshair, tooltips, mouse events
***
## 🎉 **You’re Done!**
You now have a live candlestick chart of DOGGOTOTHEMOON using Maestro’s [Market Price API](https://docs.gomaestro.org/bitcoin/market-price-api/overview) with the [TradingView](https://www.tradingview.com/) [lightweight-charts](https://github.com/tradingview/lightweight-charts) library.
Customize it further with indicators, multi‑symbol support, or integrate it into your DeFi dashboard.
Be sure to review Maestro's rate limits and [pricing tiers](https://www.gomaestro.org/pricing) to select the plan that best fits your application's needs.
***
**Support**
If you are experiencing any trouble with the above, reach out on [Discord](https://discord.gg/ES2rDhBJt3).
***
### 7. Next Steps & Customization
The following considerations can help you to extend this tutorial to fit more of your application's needs.
* You can make the chart data **mempool-aware**- meaning it returns data about trades that have *not yet been confirmed*- by passing in an optional `boolean` value to `fetchCandles()`, such as `const candles = await fetchCandles(true);`
* **Time Range**: add `from`/`to` (Unix seconds) to `fetchCandles()`
* **Carry**: `url.searchParams.set('carry','true')` fills gaps with synthetic candles
* **Styling**: tweak [`createChart` options](https://github.com/tradingview/lightweight-charts#configuration)
* **Interactivity**: add crosshair, tooltips, mouse events
***
## 🎉 **You’re Done!**
You now have a live candlestick chart of DOGGOTOTHEMOON using Maestro’s [Market Price API](https://docs.gomaestro.org/bitcoin/market-price-api/overview) with the [TradingView](https://www.tradingview.com/) [lightweight-charts](https://github.com/tradingview/lightweight-charts) library.
Customize it further with indicators, multi‑symbol support, or integrate it into your DeFi dashboard.
Be sure to review Maestro's rate limits and [pricing tiers](https://www.gomaestro.org/pricing) to select the plan that best fits your application's needs.
***
**Support**
If you are experiencing any trouble with the above, reach out on [Discord](https://discord.gg/ES2rDhBJt3).